Activity and Mood Statistics
Daylio provides many statistics and charts to display your data. This page is focused on charts you see when you tap on mood or activity from the Stats screen.
Frequency
Visual of these stats changes with the interval you have selected. It measures how many repetitions you have in the last period and compares it to the period before. We also provide visual representation with a color code that matches your mood colors.

Influence on Mood
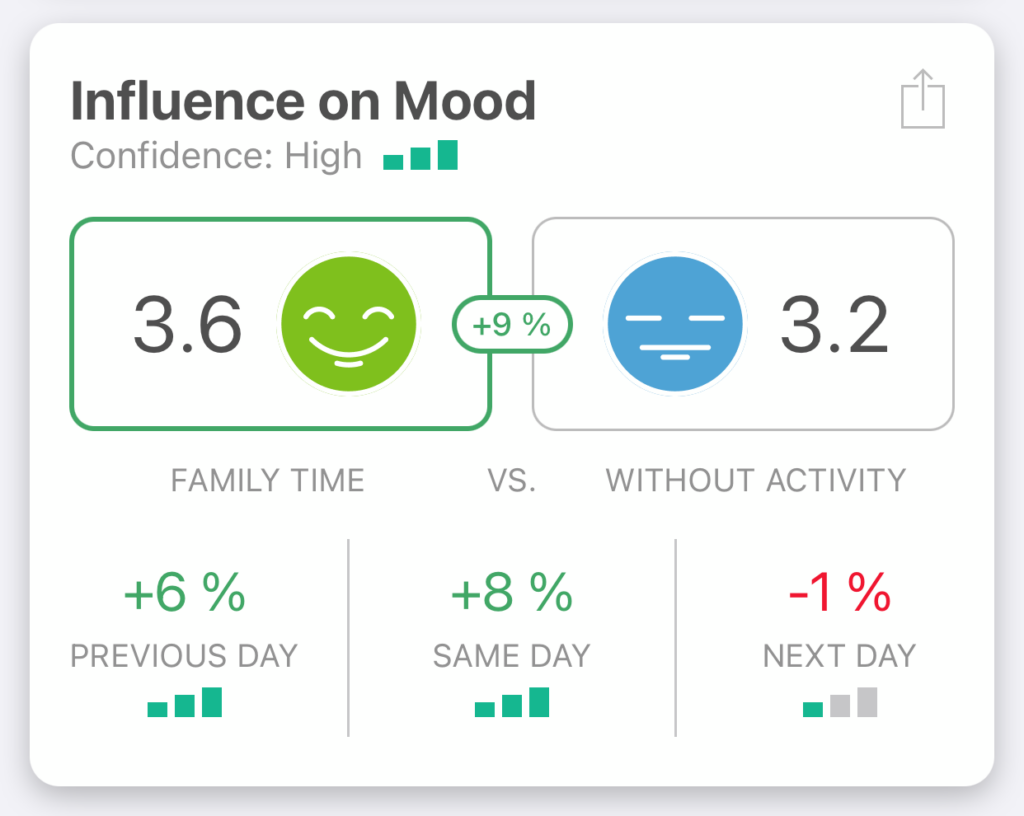
We are very proud of our Daylio charts, and the crown jewel is undoubtedly Influence on Mood statistic. Here you can see how any activity might be influencing your wellbeing.
Since it contains many insights, it might be harder to read. We hope this article will help you.
You can find this statistic after you go to Stats and tap on any of your activities.

Confidence
Confidence has three levels Low, Medium, and High. Confidence represents how much we believe the number is correct. High confidence means the calculation is based on rich source data and provides significant results. Low confidence might describe a specific trend, but you should not take it at face value.
Useful source data need many activity occurrences in different combinations. But we also need entries without this activity to make a comparison.
Four percentage numbers:
- With and without activity
- This percentage represents a comparison of entries that contain and do not contain activity.
- Example: How entries with exercise make you feel in comparison with entries without exercise.
- Previous Day
- Here we compare how entries differ the day before the activity occurred.
- Example: How exams make you feel the day before when you have no exams.
- Same Day
- “Same Day” compares whole days with and without the activity. If you have only one entry per day, it should be the same as the first percentage, “With and without activity.” If you have more entries per day, this number will be different.
- Example: How good sleep makes you feel vs. days without adequate sleep. You can mark activity just once a day to see its influence on the whole day.
- Next Day
- This is a comparison of the day with activity and the following day without activity.
- Example: How drinking makes you feel the day after. It might be fun the same day but impact you negatively on the next day.
Longest Period
Here we compare the longest period with activity/mood and without. Pretty straightforward. The period might change with the interval you select – Last 30 Days, Last Year, or All-Time.

Mood Count
Here we display the exact number of moods and graphical representation of their ratio. Which mood is dominant for the selected activity?

Related Activities
Which activities have an influence on your mood?
You can see the selected mood and scale which represents a number of percents. The higher the number the more this activity occurs during this mood. Below you can see the top activities which occur with selected moods.

Occurrence During Week
The X-axis represents days of the week. The height of the bar measures the repetitions during that day. How much do you repeat this activity/mood on Monday or any other day of the week?


